 "Bob Loblaw Made Me Make a Phoney Phone Call to Edward Rooney" (braddelaparker)
11/08/2016 at 13:23 • Filed to: f1, formula 1, austin, cota, usgp, texas
 2
2
 2
2|
"Bob Loblaw Made Me Make a Phoney Phone Call to Edward Rooney" (braddelaparker)
11/08/2016 at 13:23 • Filed to: f1, formula 1, austin, cota, usgp, texas | 2
| 2 |
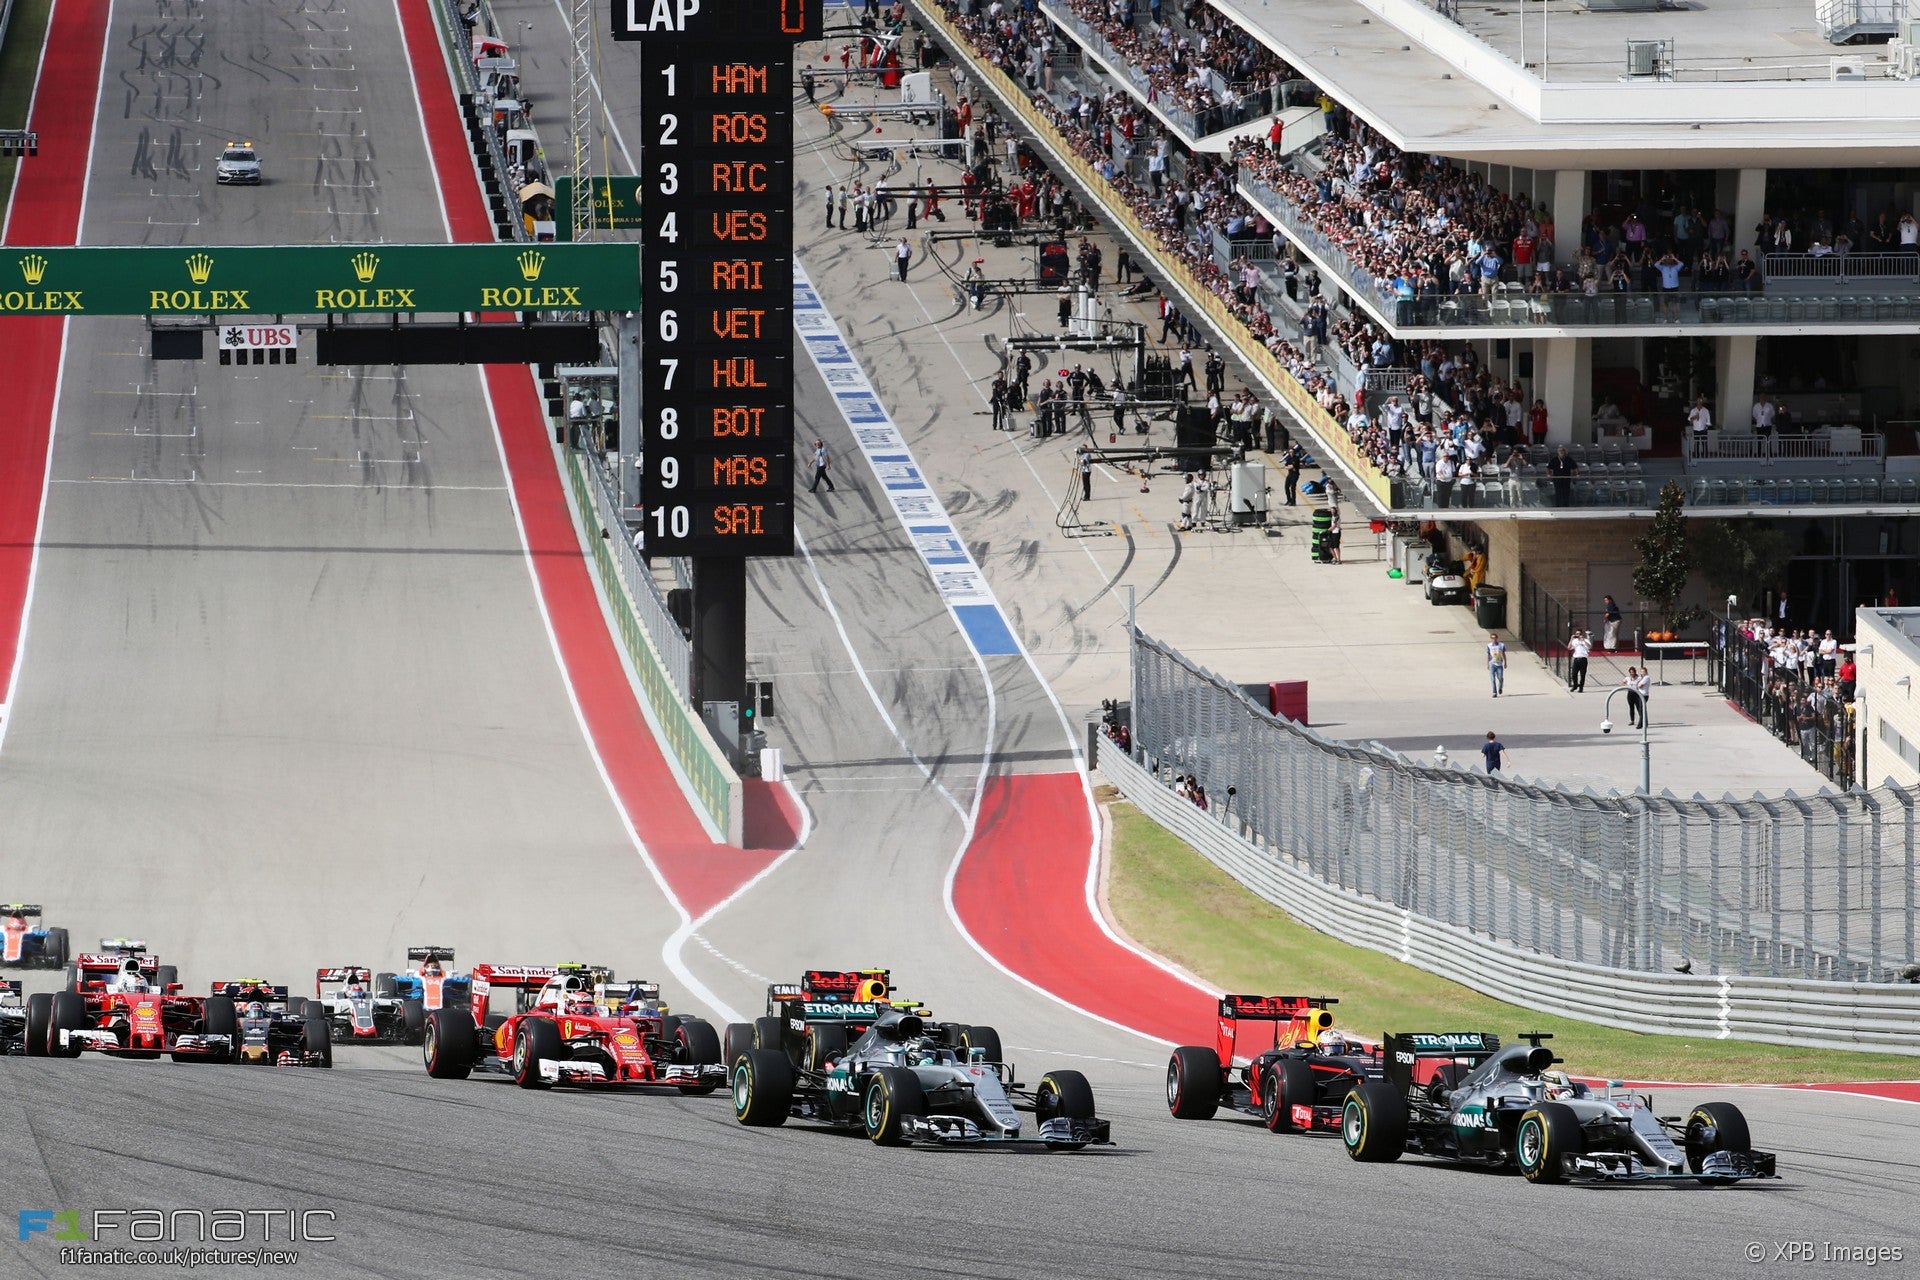
The current iteration of the USGP at Circuit of the Americas has been a success, even in spite of this year’s snoozer of a race. Other fans I spoke with at the race had praise for the all elements of the event from the circuit to the ancillary activities in Austin. Members of the traveling circus that is Formula 1 media, who see every detail of every race, continue to count COTA as a highlight of their years. Perhaps most surprising, most of the drivers appear to continue to greet the race with anticipation and excitement after five years.
The 2016 race weekend also greeted attendees (and Taylor Swift) with some of the best weather the race has seen in its time at COTA, and the transportation logistics finally appear to be working as well as possible after several years of missteps. And yet all weekend there was a palpable sense of impending doom among attendees, a feeling that just as track management had figured this thing out it may all fade away.
And that feeling isn’t without reason. As early as March of 2016 the race was still listed on the race calendar as “subject to agreement” due to a funding dispute between the track and the state of Texas. Add in miserable turnout (but great race) in 2015 due to monsoon conditions, sliding year-over-year attendance, and Bernie Ecclestone’s “negotiations” with legacy tracks like Monza and it’s tough not to be concerned about the race’s long-term viability in Austin.
We can talk ad nauseam about the impacts of the Mexican GP or waning US interest in the sport or whatever you’d like, but the reality for the USGP as it exists at COTA comes down to hosting fees. I’ll not go into detail on the background of the imbroglio underlying why hosting fees have become an issue (the Jalopnik team has done a great job reporting on and analyzing these issues) other than to explain that the bulk of the hosting fees paid to Formula One by Circuit of the Americas are subsidized by a vehicle known as the State of Texas Major Events Trust Fund. These are state funds that have been earmarked for the purpose of bringing world class events to the statement with the intent of boosting economic output, the cost of which is theoretically recovered through sales taxes from increased spending. The State’s original agreement with COTA was to pay $25 million annually out of this fund, which was decreased after the 2015 race to $19.5 million.
I wouldn’t like to debate the relative merits of whether public subsidies of private sporting events are right or wrong or whether the State of Texas has a contractual obligation to the original amount. What I’m interested in is taking a dive, somewhere between a back-of-the-napkin-calculation and a full third party consulting report, into the economic relationship between the Major Events Trust Fund and COTA.
I’m going to begin with a bag full of disclaimers because my day job is in financial consulting and disclaiming any and all responsibility for the actual content of what my analyses say is 90% of my job. I’ve had to rely on a lot of assumptions and estimates of my own as the data needed to compute this perfectly often doesn’t exist or is difficult to come by. Additionally, there are several different interpretations of what “economic impact” means and how we define that can vastly influence our conclusion on the economics. I’ve also made it a point to trade complexity for simplicity wherever possible, partly because I’m doing this in my free time, partly to aid readability and understandability for readers, but largely because I don’t want to provide a false sense of precision. Complex models can make inaccuracy seem appealing through precision, but I generally choose to apply Occam’s razor in professional settings and have done so here as well.
What I can promise is that these estimates have been made in good faith with an effort to be as accurate as possible. Yes, I’m a rabid Formula One fan and this subsidy makes a race in my backyard possible and I’ve taken full advantage of that as a race fan. But I’m also a taxpayer in the State of Texas who is generally opposed to direct private company subsidies of any type, much less those for sporting and special interest events. The mistakes in this analysis are much more likely to be due to my not having thought through something properly rather than intentional misrepresentation.
Measurement
As I mentioned above, I’ve chose incremental sales tax revenues as my metric for economic impact. There’s an argument to be made that in a situation like this there are several layers of effects experienced by a community/region in addition to direct sales tax receipts taken in by the government. This is probably true, but the measurement of these impacts presents two issues:
1) The impact upon private businesses and individuals caused by a public subsidy of another private business’s activity is not a recovery of the funds but rather a transfer of the subsidy from one private entity to another. This increases the total number of entities positively impacted by the subsidy but it doesn’t recover the funds and it still applies to a relatively localized portion of the population despite the funds being provided by taxpayers across the state.
2) More important, in my opinion, is that every such measurement I have seen is rife with nebulous definitions and manipulated assumptions consistent with the vision of the person/group behind the modeling. It’s one thing to take a stab in the dark looking towards the future; it’s another to take a stab in the dark that you’ll never have the information or capacity to measure historically. For a great example of this, take a look at the ongoing spat between the Dallas Morning News and WFAA TV in Dallas over the economic impact of the proposed new Texas Rangers baseball stadium in Arlington. In short, it’s a goddamned mess and it’s the result of an investigative journalist manipulating assumptions in a manner to fit the narrative that they’ve already defined.
As such, I’m applying the principles of simplicity here and limiting the measurement to impacts that are easily measured, have a historical basis for comparison, and/or I’m reasonably sure of the accuracy of more elements of the model than not. These measurement bases are:
1) Hotel occupancy taxes , including both state and municipal taxes. Hotel occupancy and average room rate data is widely available, has a historical baseline for comparison, and the taxes upon hotel occupancy are easily calculated.
2) Direct sales tax revenue from race tickets, parking passes, and shuttle revenue. This data is somewhat tougher to come by due to COTA being a private entity, but we have a reasonably tight range for estimation of the inputs and the calculation isn’t overwhelmingly sensitive to small changes in those assumptions.
3) Indirect tax revenue from all other ancillary expenses such as food and beverage purchases both on and off track plus on-site merchandise purchases. This was the most difficult of the three measurement bases to model since most inputs require an estimate or assumption based on gut feel without quantitative support. As such I went ahead and attempted to model this directly, but in the end my conclusion for the analysis as a whole was instead based on backing into this number which I’ll explain later.
Yes, there are other measurement bases that could possibly add to the impact (rental cars, airport fees, etc.), but the effect of most of these would be hyper-local, immaterial in comparison to the total impact, or both. If the analysis lives or dies by the measurement bases left out, that’s a conclusion in and of itself.
Key Assumptions
There are a handful of key assumptions in the model which have an out-weighted impact and permeate the analysis.
Attendance
Attendance is the primary assumption for the entire analysis. A change in attendance estimate of 20,000 in either direction can move the total tax impact as much as $2 million. Additionally, I’ve measured the economic impact of attendees differently based upon their geographical original, i.e. attendees from outside of the state of Texas have a different economic value to Texas than an attendee from Texas but not from Austin who will have a different economic value than someone local to Austin.
The key figures are as follows:
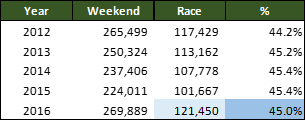
Total unique attendance in my model uses race day attendance as a proxy for an estimated three-day-equivalent ticket sales figure. COTA has not yet published 2016 race day attendance but did publish three day attendance for the race at 269,889. An analysis of the prior years of the race shows a very tight average ratio of race day attendance to weekend attendance of 45%; applied to 2016 publicized weekend attendance of 269,889 we get estimated 2016 race day attendance 121,450. This would be the best race day attendance of the GP’s life so far by about 4,000 attendees as compared to the inaugural race’s 117,429, which is consistent with media reports and my own eyeballing of the grounds while at the race.
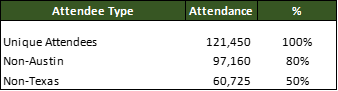
Of these 121,450 unique attendees, I assumed 80% were from outside of Austin, and 50% were from outside of Texas; these numbers are pure assumption based on my gut feeling and anecdotal evidence from having been out at the race three of the five years so far. Plugging these percentages in yields 121,450 unique total attendees; 97,160 unique attendees from outside of Austin; and 60,725 unique attendees from outside of Texas (see table below).
I did not further break down the attendance into US/foreign visitors as the stratification was already fairly hand wavy (that’s technical speak for “I know it’s bullshit but I don’t have a better way”), and from my point of view the economic impact of any two attendees from outside the state of Texas, all other variables held constant, would have similar impacts upon the State of Texas regardless of their geographical origin. Again, these elements are the most impactful qualifying assumptions embedded into this model. No, I’m not thrilled with my methodology. Yes, I’m fairly confident that these estimates are in the ballpark. Yes, I’m more than happy to hear you out on alternative methods or assumptions for estimation provided you have something quantitative to point me to.
Tax Rates
Sales tax is assumed at 8.25% which is the combined rate for the state of Tax plus the Austin local sales tax rate.
Hotel occupancy taxes are estimated at their statutory amounts of 6% for Texas and 9% for Austin.
State franchise tax is estimated at 0.75% of revenues less a 30% margin. Franchise tax in Texas is a gross receipts (revenue) tax on businesses with over $1mm in revenues. The reality of franchise tax is that it’s heinously complex and represents horrible tax policy, but it’s a relatively small component of the tax receipts in this model and the added precision of a more complex model for this tax wouldn’t add to the quality of the model and would only serve to remind me of why I left a career in corporate tax after just two months. Franchise tax is estimated in this model as a part of direct revenues and hotel revenues as those are the businesses in the analysis which are likely to face a franchise tax burden in Texas due to their size.
Now that I’m done boring you to death, let’s look at the model.
Hotel Tax Revenues
Let’s start with hotel tax revenues. They’re the easiest to model and have the best publicly available data to use in crafting assumptions and inputs.
Room Nights
We begin by estimating the total number of room nights that race goers command in the impact period. We again use the triumvirate of Austinites, Non-Austinite Texans, and Non-Texans to stratify our estimate.
Right off the bat I assumed that Austinites would not require any lodging and thus would not add any room nights to this total.
Left with just non-Austinite Texans (there has to be a better way to say that) and non-Texans, my first input was to estimate the percentage of attendees who, like me, had a place to crash in Austin and did not purchase a hotel room. I assumed 35% of Texans would have a place to crash, while only 15% of non-Texans would have a place to crash. Both numbers are pulled out of thin air, but I believe both to be sufficiently conservative in that they both assume more people were crashing at a friend’s place than I expect reality would reflect.
Next we estimate the average number of occupants per room. I assumed 2/room for Texans and 2.5/room for non-Texans, based upon my observation that most groups I saw were out in groups of two to three, but that the Europeans and Central/South Americans tended to be in slightly larger groups than the Texans or non-Texan Americans. Sensitivity is moderate with this input: putting each estimate at three per room drops the total revenue to $4.18 million, a 21.58% decrease; setting each to two occupants per room raises total revenue to $6.27 million, a 17.64% increase.
Next, we assume inputs for the number of nights needed per class of attendee. Texans I spoke with were split about 50/50 on whether they were spending two or three nights in Austin, so I placed them at 2.5 nights each, and assumed that those coming from further away would make a three or four night stay of it and pegged them at 3.5 nights each. Sensitivity is mild to this input. Dropping each measure half a night decreases revenue by $850k or 15.95%; raising each half a point results in a 15.95% increase in revenue to $6.1 million.
Folding all of these inputs in based on the estimated attendance stratification presented earlier, we calculate a total room nights figure of 101,866.
Room Rate and Occupancy Rate
Room rate data was available from a variety of sources, but most of them didn’t have both the regular room rate and race week room rate data I was looking for. As such, I utilized a 2015 article on average room rates in Austin to derive the regular rate of $127.33 and relied upon a post-2012 race article on ESPN F1 to derive the race week room rate of $393.69. I’m currently working on finding better data that has a consistent measurement base for comparison, but anecdotally both of these figures seem quite accurate.
Average occupancy was widely available from the same 2015 article referenced above at 72.3%. Race week occupancy was not easily found, so I plugged in 90% as a best guess. Again, that seems very fair given my experience down at the race, and hotels in Austin-proper might as well have been running at 100% occupancy in 2012 and 2014 although I wasn’t able to get a feel for 2015.
Additive vs. Displacement Model
The concept of revenue displacement is one of the most contentious debates in public financing/subsidy conversations. Many pro-subsidy models assume that 100% of the economic impact brought in by events or stadiums is in addition to the baseline impact in a given location; critics of this approach suggest that economic impact from special events often displaces normal spending, and thus an additive model overstates the true economic impact.
It’s a more controversial conversation with regards to restaurant and bar spending, but it’s safe to say that in the case of hotel revenue a displacement model is most appropriate. Thus, the model gives a boost to the 72.3% for the difference between regular room rates and race week room rates and a full $393.69 revenue impact for occupancy levels above typical occupancy. The displacement model produces $34.3 million in hotel spending versus the 100% additive model’s $40.1 million. I chose to apply the displacement model as I believe it more accurately reflects the fundamental economics of the spending impact.
Incremental Revenue
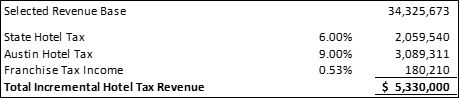
From here the calculation is simple. Using the $34.3 million room revenue base from the displacement spending model we sum the dollar values of the 6% and 9% state and local hotel taxes and the franchise tax to come to a rounded total incremental hotel tax revenue of $5,330,000. This represents 27% of the total 2016 subsidy of $19,500,000 and 21% of the original 2012-2015 subsidy.
Direct Race-Related Tax Revenues
Estimating direct race-related tax revenues is a slippery battle because while we have a very good idea of what individual tickets sell for and can even generate a reasonable estimate of permanent seating capacity/sales, the dominating presence of general admission tickets in the product mix makes estimating an average ticket price somewhat difficult. In concert with the philosophy I’ve employed elsewhere in this analysis I’ve chosen apply a simple model with conservative inputs to use as a base case, and then we’ll examine the impact of changes in key variables to evaluate the sensitivity and thus reasonableness of the end conclusion.
The starting point in this analysis is to estimate the average ticket price, keeping in mind that these needs to match up conceptually with the idea that we’ve estimated attendance on a three-day ticket basis. This assumption is tough to estimate because of the high concentration in the product mix of low-priced general admission tickets while the much lower quantities of seated tickets sell for prices between two and upwards of ten times the price for a GA ticket. This is compounded by the following issues:
COTA (understandably) has not made ticket mix data available;
GA capacity is not published and would be difficult to nail down; and,
Main grandstand capacity is listed at 9,000 people, but I’ve yet to find capacities for the semi-temporary grandstands, suites, and boxes that go up around the rest of the track for the USGP.
As such I’ve again taken a simple, conservative approach to this estimation and we’ll take a look at how changing those assumptions might change the value of the direct race-related tax revenues.
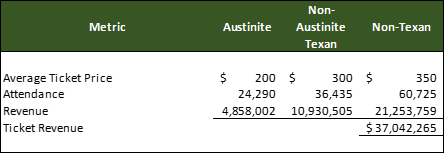
Ticket prices were estimated at the following figures:
Austinites: $200. This assumes that the Austinites at the race are much
more likely to be at the race simply because it’s in tow and convenient, may
not be die-hard F1 fans, and thus are the least likely to splurge on a ticket.
Most GA tickets were sold at either $150 or $165, so $200 gives credence to
some of those who purchased grandstand tickets;
Non-Austinite Texans: $300. Read into this what you will. It’s still
reasonably convenient for most non-local Texans to attend the race, so my
analysis price sensitivity will be somewhere between Austinites and non-Texans.
Non-Texans: $350. For a variety of reasons, I assume that the average attendee coming from out of the state is going to spend more on their tickets than an average in-state attendee due to the decreasing percentage of total investment that the ticket prices represents as a part of total spend. I could easily be convinced this isn’t right, but it jives with my observations about the attendee mix at the race.
Using these inputs, we calculate total ticket revenues of $37 million and change, as evidenced below.
Now we’ll test some assumptions. For expediency we’ll do this in a bulleted list:
All tickets at $165: $20 million in revenue, a 46% decrease from baseline;
All tickets at $200: $24 million in revenue, a 34% decrease from baseline;
All tickets at $300: $36.4 million in revenue, a 1.64% decrease from
baseline;
All tickets at $305: same revenue as baseline; and
All tickets at $350: $42.5 million in revenue, a 14.75% increase over baseline.
Clearly this is a fairly sensitive input, but I like to think that my assumptions are reasonable given an average ticket price of $305. That may be a touch aggressive when looking at your median ticket buyer, but that number also incorporates the idea that a single suite can generate as much as 100 GA tickets worth of revenue.
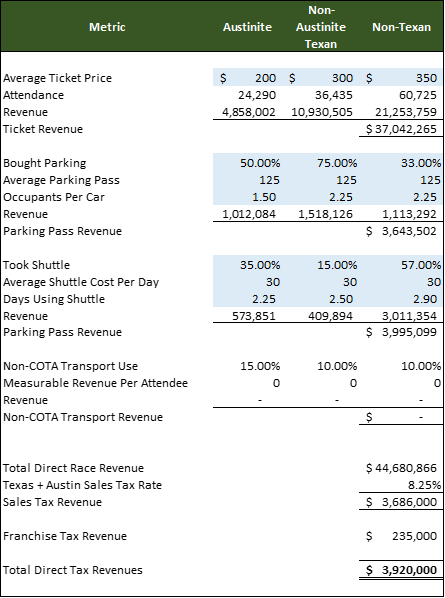
The other direct race related revenues come from transportation to/parking at the event, which we model as a zero sum game. You either buy a parking pass, pay for a shuttle, or use a non-COTA transportation/parking option of some type which would often result in a non-taxable transaction (e.g. you pay $20 cash to park on the lawn of a homeowner near the circuit; there’s a .000000001% chance of sales tax being reported on that transaction).
Average parking pass costs are estimated at the cheapest available lot cost for three days. We also plug in an estimate of the number of attendees per car. Shuttles costs are estimated at a blended rate between the downtown $50 daily shuttle and the more remote expo center shuttle at $25 a day and are further adjusted with a ‘days using shuttle’ metric which ties to the expected number of days each classification of attendee is expected to be at the track. Non-COTA options are given a percentage of attendees to tie everything out but not economic value.
Total direct race revenue is estimated at $44,680,866 using the inputs reference above, to which we apply an 8.25% sales tax rate and franchise tax at 0.75% of 70% of revenues for total tax receipts related to direct race revenues of $3.92 million (see table below).
Indirect Race-Related Tax Revenues
Indirect race-related tax revenues are defined as those sales tax revenues resulting from race attendee spending in and around Austin as a result of being in town for the race, along with meal, beverage, and merchandise purchases made at the track. Yes, the latter group is a direct result of the race, but the vendors at the track receiving such revenues are varied and extend beyond the track itself, thus I’ve grouped them with the other thousands of businesses impacted by the race but not through ticket or parking sales.
Estimated Expenses
I’m not going to spend a lot of time going through this analysis simply because its estimation is incredibly nebulous and subjective and there’s a wide dispersion of spending habits among attendees. I’ll show you the table I generated when initially trying to estimate these amounts so you can see the thought process, but ultimately my conclusion doesn’t rely on them:

The key takeaway is that I estimated $163 of spending per attendee using this
model. For a point of comparison I just ran through my credit card statement
over the race weekend and calculated right at $300 of spending between me and
my wife; combined with what went on her card we were probably at about $350 for
the weekend. I think she and I would find ourselves on the lower end of the
spending spectrum for a variety of reasons, mostly that we were only out at the
track for two days, didn’t go out on the town like we had for prior races,
we’re generally fairly frugal people, and we weren’t on a vacation.
For the purposes of testing the sensitivity, increasing spending to $300 per attendee results in sales tax revenues of just a hair over $3 million. It’s also worth noting that I applied no franchise tax estimates to this spending as I assumed that most of the restaurants and local businesses benefiting from indirect spending generate less than $1 million in annual revenues and thus are not subject to franchise tax.
Breakeven Expenses
Instead of viewing this third element of the analysis as a build-up of expenses, I decided instead to turn the equation around and backsolve for the level of spending per attendee that would be necessary to bridge the gap between the total subsidy and the tax revenues we have already identified through direct and hotel tax revenues.
I prefer this approach because it eliminates a large swath of difficult to support assumptions and also because it’s far more descriptive than estimating expenses. That is to say, instead of debating myriad assumptions and inputs, using a backsolve method will result in single number for spending per attendee that can be easily conceptualized and debated without getting caught up in the math and structure of the calculation. The breakeven calculation is shown below:
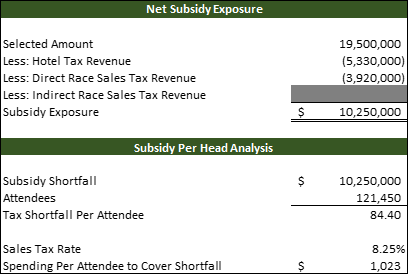
At first glance it doesn’t look so bad. Subtracting the hotel tax and direct race sales tax revenues from the 2016 race subsidy leaves $10.25 million in subsidy to be recouped by indirect spending. Divided by the 121,450 attendees and that’s only a sales tax shortfall of $84.40. But dividing that by the sales tax rate of 8.25% gives us the spending necessary to break even on the $19.5 million shortfall, which comes to $1,023 per attendee. That total spending number? $124 million, and that doesn’t get to count hotel sales or direct race sales.
In an attempt to reconcile this number with our attendance splits based on geography and the principle of displacement suggesting that Austinites, and to some extent Texans, will contribute far less net gain in tax revenues as compared to non-Texans, I estimated a spending split to see how allocating that $1,023 per attendee might affect the numbers.
Better but there’s still an awfully big spending gap to be hurdled. This implies non-race spending of $1000 between my wife and I, triple was we actual spent, and suggest that a non-Texan couple would spend $3200 in addition to hotel, race tickets, and parking. Even with the level of wealth that an F1 race attracts I think that’s a tough proposition.
Sensitivity Analysis
For one last stab at the variance we could see in the breakeven/backsolve model, we manipulate directly the two main numbers that we’re comfortable estimating: hotel tax revenue and direct race tax revenue. As a reminder, here’s where those numbers fall based on our “base case” estimates:
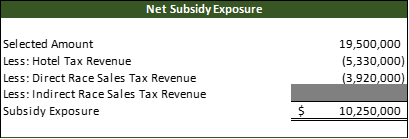
I’m fairly certain that our hotel tax revenue number is reasonably accurate, and while I’m less certain that I’m as accurate on the direct race sales tax revenue, I’m skeptical that the error is that I’m low . But I’m a natural pessimist, so let’s move some things around anyway.
To generate a best case scenario under my hotel tax model, we’ll apply the following inputs:
Two occupants per room
Three night stay for Texans, four night stay for
non-Texans
Increase race week average room rate to $425, up
from $393
Assume 99% hotel room occupancy in Austin during race week
These four inputs together bring us to a best case incremental hotel tax revenue of $8,000,000.
To generate a best case scenario under the direct race revenue analysis, we apply the following inputs:
Assume total average ticket price of $347.50
Decrease occupants per car for parking and
increase average parking pass price to $175
Decrease non-COTA transportation use to 5% per category of attendee
Together these changes result in a best case scenario of total direct race tax revenues of $4,570,000. These changes were surprisingly effective to me. Net subsidy exposure drops to $6.9 million under this scenario, with the spending required per attendee to cover that at a less unreasonable $692 each. Taking that further and stratifying among geographic origin makes the numbers seem nearly palatable, as shown below:
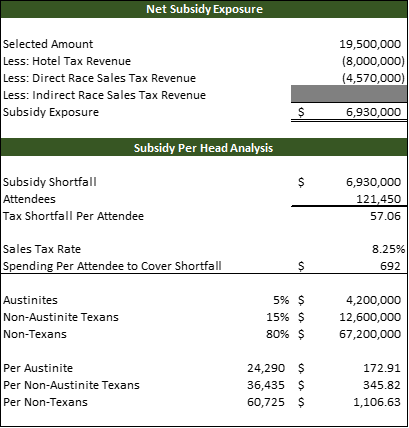
These numbers still seem high to me, but they’re not out of the realm of possibilities, even if they’re a standard deviation or so away from what I expect the mean case to be.
Summary and Takeaways
Alright. Breathe, take a break, go to the restroom. That was a lot of numbers and mouth diarrhea and I’ll be surprised if anyone makes it to this paragraph without skipping ahead from the start to figure out what to be upset about right off the bat (kudos to you if you did, though, it was a savvy move).
At this point you’ve likely generated your own opinion, but this is my model and my article so I’m going to burden you with just a few more of my words before I let you go.
From a pure sales tax recovery standpoint, which is to say that the entire subsidy is recovered through immediate, identifiable sales tax receipts to the state and Austin, the very possible best case scenario is that the state is breaking even, and I would say that the likely scenario leaves the state on the hook for $2-3 million a year under the current subsidy ($8+ million under the original).
What I can say, though, is that I’ve seen very few people approach this discussion with such a limited scope. The way I see it there are two explanations to explain any calculated shortfall:
The net shortfall will be recovered at some
point on the timeline due to a variety of knock-on effects that occur as a
result of the city and state being placed in the international spotlight. The
race is bringing international notoriety to Austin and could spur heightened
tourism in the region for decades to come.
The subsidy at its core winds up morphing from a
subsidy to the track to a subsidy of the countless small (and otherwise)
businesses across the city and state, which is (to some) preferable to a
subsidy directly to and only for a single entity representing over a billion
dollars in investment by people who have plenty of money.
I don’t love either argument, but I hate the first less. It’s fairly weak in that Austin is a fairly well know, well traversed quantity in this country as it is, but I could buy the premise that its popularity internationally could catch up significantly with its popularity around the US. And I’ll also say that as a native Texan living in Dallas, Austin is the only place here that’s a real tourist destination, so if you’re going to attempt to attract tourism you’ve picked the right spot to do so.
The second argument is bad policy, regardless of whether you support government subsidies of this type en masse or not. Subsidizing small businesses sounds great on the surface, but it’s still a policy of taking a quantity of state funds that were generated across a broad taxpayer base and diverting them to a much narrower base of recipients both categorically and geographically. There are a lot of factors that could convinced some people otherwise, but it’s a weak argument.
What I think this analysis can say with some certainty is:
There is a level of subsidy that can be
supported by sales tax revenues alone without regard for general economic
impact otherwise.
That level of supportable subsidy is absolutely
less than the original $25 million amount
The current $19.5 million subsidy may actually be in the ballpark of what’s sustainable, but something around the $15 million ultimately seems more sustainable.
For what it’s worth, COTA chariman Bobby Epstein mentioned at the race last weekend that COTA doesn’t have to have the full $25 million in order to continue hosting the F1 race, they just need something . It certainly seems like there’s a case to be made for a subsidy of some amount based on the ability to claw back that expenditure through sales tax receipts, albeit it at some level less than the original subsidy.
I’m still not particularly fond of public financing of private events, but looking at these numbers it’s hard to be upset as an F1 fan and, let’s face it, a Taylor Swift fan.
—————————————————————————————-
Original un-Kinja’d post available at !!!error: Indecipherable SUB-paragraph formatting!!!
 For Sweden
> Bob Loblaw Made Me Make a Phoney Phone Call to Edward Rooney
For Sweden
> Bob Loblaw Made Me Make a Phoney Phone Call to Edward Rooney
11/08/2016 at 13:32 |
|
I think the race will survive, as long as COTA also attracts WEC and MotoGP. However, the finances will improve substantially if they can also host NASCAR races. Indycar races would certainly help as well. Though that would mean becoming friendly with Texas Motor Speedway.
 Leon711
> Bob Loblaw Made Me Make a Phoney Phone Call to Edward Rooney
Leon711
> Bob Loblaw Made Me Make a Phoney Phone Call to Edward Rooney
11/08/2016 at 13:55 |
|
This sort of thing is also a crisis with the British GP, which is the only non-state supported race on the calendar, there has been record attendance in the last few years. Despite the success of the race the circuit owners have extremely low cash reserves (reports of sub Ł10k at he last financial year) and they are desperately looking for a buyer, Jaguar Land Rover were a potential buyer but backed out due to an existing contract with Porsche that allows Porsche to have exclusive track access 45 days a year. Another retracted offer was by the owner of Ginetta cars, whose offer was not accepted by the deadline he imposed. There is only one active party left, Motorsport Vision, owned by former F1 Driver Jonathan Palmer, father of current Renault F1 Driver Jolyon Palmer. Motorsport Vision owns Brands Hatch, Snetterton, Oulton Park, Cadwell Park and Bedford Autodrome. They have made a decent job of running these circuits but realistically they don’t have anything as big as Silverstone, can they handle it? there’s no one else even remotely qualified for it though.
Wall of text, sorry.